 |
gtkIOStream
1.7.0
GTK+ << C++ IOStream operators for GTK+. Now with ORBing, numerical computation, audio client and more ...
|
|
gtkIOStream
1.7.0
GTK+ << C++ IOStream operators for GTK+. Now with ORBing, numerical computation, audio client and more ...
|
simplistic plotting class which mimicks a octave approach to plotting Use this class as if you were plotting in octave. More...
#include <Plot.H>
Public Member Functions | |
| Plot (void) | |
| void | setBackground (const char *clsStr) |
| void | setBackground (ColourLineSpec cls) |
| void | setBackground (const GdkColor gdkC) |
| GtkWidget * | gca (void) |
| Get the current axis. More... | |
| GtkWidget * | getCurrentAxis (void) |
| Get the current axis. More... | |
| void | show (void) |
| void | hide (void) |
| GtkDataboxGraph * | plot (gfloat *x, gfloat *y, int cnt) |
| GtkDataboxGraph * | plot (gfloat *x, gfloat *y, int cnt, const char *clsChar) |
| GtkDataboxGraph * | plot (gfloat *x, gfloat *y, int cnt, ColourLineSpec &cls) |
| GtkDataboxGraph * | plot (gfloat *x, gfloat *y1, gfloat *y2, int cnt) |
| GtkDataboxGraph * | plot (gfloat *x, gfloat *y1, gfloat *y2, int cnt, const char *clsChar) |
| GtkDataboxGraph * | plot (gfloat *x, gfloat *y1, gfloat *y2, int cnt, ColourLineSpec &cls) |
| GtkDataboxGraph * | semilogx (gfloat *x, gfloat *y, int cnt) |
| Plots with a logarithmic ordinate scale Plotting the data with a logarithmic ordinate scale and a default colour. More... | |
| GtkDataboxGraph * | semilogx (gfloat *x, gfloat *y, int cnt, const char *clsChar) |
| Plots with a logarithmic ordinate scale Plotting the data with a logarithmic ordinate scale. More... | |
| GtkDataboxGraph * | semilogx (gfloat *x, gfloat *y, int cnt, ColourLineSpec &cls) |
| Plots with a logarithmic ordinate scale Plotting the data with a logarithmic ordinate scale. More... | |
| GtkDataboxGraph * | semilogx (gfloat *x, gfloat *y1, gfloat *y2, int cnt) |
| Plots with a logarithmic ordinate scale Plotting the data with a logarithmic ordinate scale and a default colour Each x ordinate has two y co-ordinates - resulting in offset bars. More... | |
| GtkDataboxGraph * | semilogx (gfloat *x, gfloat *y1, gfloat *y2, int cnt, const char *clsChar) |
| Plots with a logarithmic ordinate scale Plotting the data with a logarithmic ordinate scale and a default colour Each x ordinate has two y co-ordinates - resulting in solid regions if line plotting. More... | |
| GtkDataboxGraph * | semilogx (gfloat *x, gfloat *y1, gfloat *y2, int cnt, ColourLineSpec &cls) |
| Plots with a logarithmic ordinate scale Plotting the data with a logarithmic ordinate scale and a default colour Each x ordinate has two y co-ordinates - resulting in solid regions if line plotting. More... | |
| GtkDataboxGraph * | semilogy (gfloat *x, gfloat *y, int cnt) |
| Plots with a logarithmic co-ordinate scale Plotting the data with a logarithmic co-ordinate scale and a default colour. More... | |
| GtkDataboxGraph * | semilogy (gfloat *x, gfloat *y, int cnt, const char *clsChar) |
| Plots with a logarithmic co-ordinate scale Plotting the data with a logarithmic co-ordinate scale. More... | |
| GtkDataboxGraph * | semilogy (gfloat *x, gfloat *y, int cnt, ColourLineSpec &cls) |
| Plots with a logarithmic co-ordinate scale Plotting the data with a logarithmic co-ordinate scale. More... | |
| GtkDataboxGraph * | loglog (gfloat *x, gfloat *y, int cnt) |
| Plots with logarithmic ordingate and co-ordinate scales Plotting the data with logarithmic ordinate and co-ordinate scales and a default colour. More... | |
| GtkDataboxGraph * | loglog (gfloat *x, gfloat *y, int cnt, const char *clsChar) |
| Plots with logarithmic ordingate and co-ordinate scales Plotting the data with logarithmic ordinate and co-ordinate scales and a default colour. More... | |
| GtkDataboxGraph * | loglog (gfloat *x, gfloat *y, int cnt, ColourLineSpec &cls) |
| Plots with logarithmic ordingate and co-ordinate scales Plotting the data with logarithmic ordinate and co-ordinate scales. More... | |
| GtkDataboxGraph * | text (gfloat *x, gfloat *y, const char *textDisp, const char *clsChar) |
| GtkDataboxGraph * | text (gfloat *x, gfloat *y, const char *textDisp, ColourLineSpec &cls) |
| void | clear (void) |
| void | clf (void) |
| void | hold (bool on) |
| void | grid (bool on) |
| void | grid (bool on, int hCnt, gfloat *hLines, int vCnt, gfloat *vLines) |
| void | limits (float min_x, float max_x, float min_y, float max_y) |
| Set the limits of the viewable region of the plot. This will set the viewable rectangle to be between the min/max specified x and y values. More... | |
| void | limits (gfloat border=0.) |
| Set the limits to autoscale Rescales the figure to show everything plotted. More... | |
| void | replot (void) |
| Instruct gtk to replot If the underlying plot data pointers haven't changed, it is not necessary to call plot again. Simply call this method to get gtk to replot the contents of the data pointers used in the last call to Plot::plot. More... | |
| void | set (GtkWidget *widget,...) |
| sets the property of the figure Various figure axis settings. This list of settings must be NULL terminated. Valid options are (either camel or lower case): More... | |
| void | connectAfter (const char *event, GCallback callback, gpointer data) |
| void | xLabel (const char *label, int *indexes=NULL) |
| void | xLabelBL (const char *label) |
| void | yLabel (const char *label, int *indexes=NULL) |
| void | yLabelTL (const char *label) |
| void | title (const char *titleStr, int *indexes=NULL) |
| void | title (GtkWidget *widget, int *indexes=NULL) |
| void | remove (GtkDataboxGraph *toRemove) |
| Plot & | operator>> (GtkDataboxGraph *toRemove) |
| gfloat | pixelToX (gint16 pixel) |
| gfloat | pixelToY (gint16 pixel) |
 Public Member Functions inherited from Table Public Member Functions inherited from Table | |
| Table (void) | |
| Table (short int rows, short int cols, bool homogeneous=true, GtkAttachOptions xOpt=GTK_EXPAND, GtkAttachOptions yOpt=GTK_EXPAND, uint xPad=0, uint yPad=0) | |
| void | initialise (short int rows=2, short int cols=2, bool homogeneous=true, GtkAttachOptions xOpt=GTK_FILL, GtkAttachOptions yOpt=GTK_FILL, uint xPad=0, uint yPad=0) |
| void | setHomogeneous (bool homogeneous) |
| void | setOptions (GtkAttachOptions xOpt, GtkAttachOptions yOpt) |
| void | setRegion (short int x_s, short int x_e, short int y_s, short int y_e) |
| void | placeWidget (GtkWidget *obj, GtkAttachOptions xOpt, GtkAttachOptions yOpt) |
| void | placeWidget (GtkWidget *obj) |
| void | getSize (uint *rows, uint *cols) |
| void | setPadding (uint xPad, uint yPad) |
| void | resize (uint rows, uint cols) |
| Table & | operator<< (int i) |
| Table & | operator, (int i) |
| Table & | operator<< (int *region) |
| Table & | operator<< (GtkWidget *obj) |
| Table & | operator<< (LinkList< GtkWidget *> &ll) |
| Table & | operator<< (Container &b) |
| Table & | operator<< (Container *b) |
| Table & | operator<< (Widget &b) |
| Table & | operator<< (Widget *b) |
| Table & | operator>> (GtkWidget *obj) |
| Table & | operator>> (Container *c) |
| Table & | operator>> (Container &c) |
| Table & | operator>> (LinkList< GtkWidget *> &ll) |
| Public Member Functions inherited from Container | |
| void | setBorder (unsigned int size) |
| unsigned int | getBorder (void) |
| Container & | operator<< (Container &c) |
| Container & | operator<< (Container *c) |
| Container & | operator<< (Widget &w) |
| Container & | operator<< (Widget *w) |
| Container & | operator<< (LinkList< GtkWidget *> &ll) |
| Container & | operator>> (GtkWidget *w) |
| Container & | operator>> (Container *c) |
| Container & | operator>> (Container &c) |
| Container & | operator>> (LinkList< GtkWidget *> &ll) |
| void | setChildrensSensitivity (bool sens) |
| bool | areAnyChildrensSensitive (void) |
| unsigned int | size () |
| Public Member Functions inherited from Widget | |
| Widget () | |
| Construcotr. More... | |
| Widget (GtkWidget *w) | |
| virtual | ~Widget () |
| Destructor. More... | |
| GtkWidget * | ref (void) |
| void | unref (void) |
| GtkWidget * | show (void) |
| GtkWidget * | hide (void) |
| bool | getVisible (void) |
| GtkWidget * | getWidget (void) |
| bool | getSensitive (void) |
| void | setSensitive (bool sens) |
| void | getSize (int &width, int &height) |
| virtual void | setSize (int width, int height) |
| void | getLocationSize (int &x, int &y, int &width, int &height) |
| void | queueDraw () |
| GdkWindow * | getWindow () |
| void | connect (const char *event, GCallback callback, gpointer data) |
| void | connectAfter (const char *event, GCallback callback, gpointer data) |
| void | connectExposeEventCallback (GCallback callback, void *data) |
| void | connectExposeEventCallback (GtkWidget *w, GCallback callback, void *data) |
| void | connectConfigureEventCallback (GCallback callback, void *data) |
| void | connectConfigureEventCallback (GtkWidget *w, GCallback callback, void *data) |
| Widget & | operator<< (DragNDrop &dnd) |
| Widget & | operator>> (DragNDrop &dnd) |
Protected Attributes | |
| GtkWidget * | axis |
| The axis widget. More... | |
| GtkDataboxGraph * | gridGraph |
| The grid which defaults to off. More... | |
| bool | holdOn |
| Whether to hold the curves or not. More... | |
| bool | gridOn |
| Whether to the grid is on. More... | |
| Protected Attributes inherited from Widget | |
| GtkWidget * | widget |
| The container based widget. More... | |
Private Member Functions | |
| template<typename TYPE > | |
| GType | findType (TYPE val) |
Additional Inherited Members | |
| Protected Member Functions inherited from Container | |
| virtual void | pack (GtkWidget *obj) |
| Protected Member Functions inherited from Widget | |
| virtual bool | checkDropValidity (GtkWidget *w, GtkWidget *sourceWidget, int info, const unsigned char *selectionStoredData) |
| virtual bool | dragDataReceived (GtkWidget *w, GtkWidget *sourceWidget, int info, const unsigned char *selectionStoredData, int length) |
| virtual void | dragLeave (GtkWidget *w, GtkWidget *sourceWidget) |
| virtual bool | dragMotion (GtkWidget *w, GtkWidget *sourceWidget, int x, int y) |
| virtual int | chooseTheTargetToUse (GtkWidget *w, GtkWidget *sourceWidget, DragNDrop &dnd) |
| virtual void | dragDataGet (GtkWidget *w, GtkSelectionData *selectionData, guint info) |
| virtual void | dragDataDelete (GtkWidget *w) |
| virtual void | dragBegin (GtkWidget *w) |
| virtual void | dragEnd (GtkWidget *w) |
simplistic plotting class which mimicks a octave approach to plotting Use this class as if you were plotting in octave.
See the readme files for information on how to get/install GtkDatabox (which is required for this Plot class)
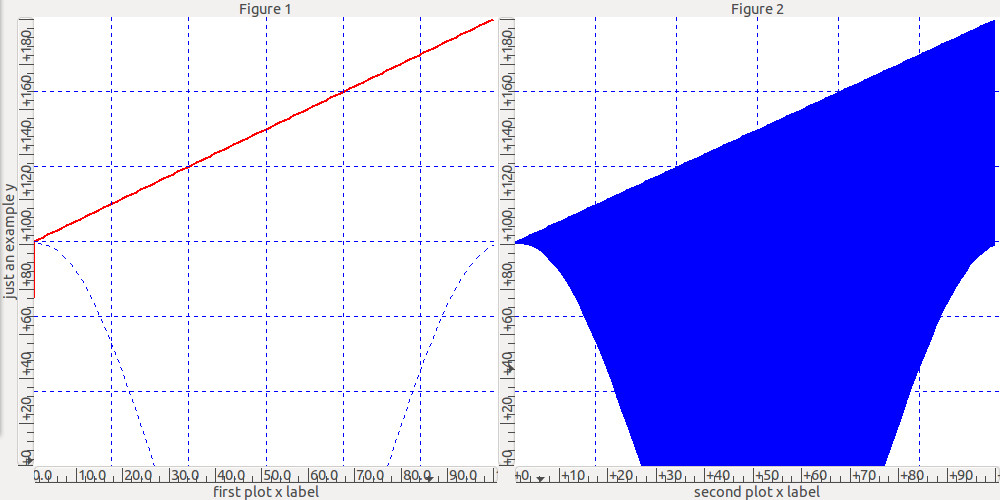
The Plot can support a title, xaxis, xlabel, ylabel, yaxis, plot, yaxis (right), ylabel (right) like so :
Here is an example of how to use :
Here is an example with two plots in the same window :
|
inline |
|
inline |
|
inlineprivate |
|
inline |
|
inline |
|
inline |
Generates a grid on the axis Check if a grid exists in gtkdatabox, if it does, then re-use it. Defaults to 5 horizontal and vertical lines
|
inline |
|
inline |
Sets the axis to hold the current plots (curves) or to wipe them
|
inline |
Set the limits of the viewable region of the plot. This will set the viewable rectangle to be between the min/max specified x and y values.
| min_x | The minimum x value to show |
| max_x | The maximum x value to show |
| min_y | The minimum y value to show |
| max_y | The maximum y value to show |
|
inline |
|
inline |
Plots with logarithmic ordingate and co-ordinate scales Plotting the data with logarithmic ordinate and co-ordinate scales and a default colour.
| x | The ordinates for plotting |
| y | The co-ordinates for plotting |
| cnt | The number of elements to plot |
|
inline |
Plots with logarithmic ordingate and co-ordinate scales Plotting the data with logarithmic ordinate and co-ordinate scales and a default colour.
| x | The ordinates for plotting |
| y | The co-ordinates for plotting |
| cnt | The number of elements to plot |
| clsChar | The ColourLineSpec object to use for plotting |
|
inline |
Plots with logarithmic ordingate and co-ordinate scales Plotting the data with logarithmic ordinate and co-ordinate scales.
| x | The ordinates for plotting |
| y | The co-ordinates for plotting |
| cnt | The number of elements to plot |
| cls | The ColourLineSpec object to use for plotting |
|
inline |
|
inline |
|
inline |
|
inline |
Plots the cnt y values at x to the axis, with a default blue colour
| x | The ordinates for plotting |
| y | The co-ordinates for plotting |
| cnt | The number of elements to plot |
|
inline |
Plots the cnt y values at x to the axis, with a specified colour and line type
| x | The ordinates for plotting |
| y | The co-ordinates for plotting |
| cnt | The number of elements to plot |
| clsChar | The specification to be used with the ColourLineSpec class |
|
inline |
|
inline |
Plots the cnt y1 and y2 values at x to the axis This plot is a region of default colour
| x | The ordinates for plotting |
| y1 | The first co-ordinate for plotting |
| y2 | The second co-ordinate for plotting |
| cnt | The number of elements to plot |
|
inline |
Plots the cnt y1 and y2 values at x to the axis. This plot is a region of colour if a line plot is specified: e.g. clsChar="k" This plot is two dotted lines if a dotted plot is specified: e.g. clsChar="k:"
| x | The ordinates for plotting |
| y1 | The first co-ordinate for plotting |
| y2 | The second co-ordinate for plotting |
| cnt | The number of elements to plot |
| clsChar | The specification to be used with the ColourLineSpec class |
|
inline |
Plots the cnt y1 and y2 values at x to the axis This plot is a region of colour if a line plot is specified: e.g. cls="k" This plot are offset bars if a dotted plot is specified: e.g. cls="k:"
| x | The ordinates for plotting |
| y1 | The first co-ordinate for plotting |
| y2 | The second co-ordinate for plotting |
| cnt | The number of elements to plot |
| cls | The ColourLineSpec class which determines the colour line type and size |
Definition at line 377 of file Plot.H.
|
inline |
|
inline |
Instruct gtk to replot If the underlying plot data pointers haven't changed, it is not necessary to call plot again. Simply call this method to get gtk to replot the contents of the data pointers used in the last call to Plot::plot.
|
inline |
|
inline |
Plots with a logarithmic ordinate scale Plotting the data with a logarithmic ordinate scale.
| x | The ordinates for plotting |
| y | The co-ordinates for plotting |
| cnt | The number of elements to plot |
| clsChar | The ColourLineSpec interpretable character array |
|
inline |
Plots with a logarithmic ordinate scale Plotting the data with a logarithmic ordinate scale.
| x | The ordinates for plotting |
| y | The co-ordinates for plotting |
| cnt | The number of elements to plot |
| cls | The ColourLineSpec object to use for plotting |
|
inline |
Plots with a logarithmic ordinate scale Plotting the data with a logarithmic ordinate scale and a default colour Each x ordinate has two y co-ordinates - resulting in offset bars.
| x | The ordinates for plotting |
| y1 | The co-ordinates for plotting |
| y2 | The co-ordinates for plotting |
| cnt | The number of elements to plot |
|
inline |
Plots with a logarithmic ordinate scale Plotting the data with a logarithmic ordinate scale and a default colour Each x ordinate has two y co-ordinates - resulting in solid regions if line plotting.
| x | The ordinates for plotting |
| y1 | The co-ordinates for plotting |
| y2 | The co-ordinates for plotting |
| cnt | The number of elements to plot |
| clsChar | The ColourLineSpec interpretable character array |
|
inline |
Plots with a logarithmic ordinate scale Plotting the data with a logarithmic ordinate scale and a default colour Each x ordinate has two y co-ordinates - resulting in solid regions if line plotting.
| x | The ordinates for plotting |
| y1 | The co-ordinates for plotting |
| y2 | The co-ordinates for plotting |
| cnt | The number of elements to plot |
| cls | The ColourLineSpec object to use for plotting |
|
inline |
Plots with a logarithmic co-ordinate scale Plotting the data with a logarithmic co-ordinate scale and a default colour.
| x | The ordinates for plotting |
| y | The co-ordinates for plotting |
| cnt | The number of elements to plot |
|
inline |
Plots with a logarithmic co-ordinate scale Plotting the data with a logarithmic co-ordinate scale.
| x | The ordinates for plotting |
| y | The co-ordinates for plotting |
| cnt | The number of elements to plot |
| clsChar | The ColourLineSpec interpretable character array |
|
inline |
Plots with a logarithmic co-ordinate scale Plotting the data with a logarithmic co-ordinate scale.
| x | The ordinates for plotting |
| y | The co-ordinates for plotting |
| cnt | The number of elements to plot |
| cls | The ColourLineSpec object to use for plotting |
|
inline |
sets the property of the figure Various figure axis settings. This list of settings must be NULL terminated. Valid options are (either camel or lower case):
In general, all properties, are specified for both X and Y axes.
|
inline |
|
inline |
|
inline |
|
inline |
A method to show all of the rulers and graphs
|
inline |
Displays text at an x and y location, with a specified colour
| x | The ordinate to place the text at |
| y | The co-ordinate to place the text at |
| textDisp | The text to display |
| clsChar | The specification to be used with the ColourLineSpec class |
|
inline |
Displays text at an x and y location, with a specified colour
| x | The ordinate to place the text at |
| y | The co-ordinate to place the text at |
| textDisp | The text to display |
| cls | The colour of the text |
Definition at line 590 of file Plot.H.
|
inline |
Set a title, by default the title is placed above the plot By changing the indexes, it can be placed in any table cell.
| titleStr | The title to display |
| indexes | The table cell to place the label in |
Definition at line 965 of file Plot.H.
|
inline |
Set a title, by default the title is placed above the plot By changing the indexes, it can be placed in any table cell.
| widget | The title to display which is expected to be a label widget |
| indexes | The table cell to place the label in |
|
inline |
Set an xlabel, by default the labels is placed below the plot. By changing the indexes, it can be placed in any table cell. For example this places it in the bottom left (same as xLabelBL) :
| label | The label to display |
| indexes | The table cell to place the label in |
|
inline |
|
inline |
Set a ylabel, by default the label is placed left of the plot. By changing the indexes, it can be placed in any table cell. For example this places it in the top left (same as yLabelTL) :
| label | The label to display |
| indexes | The table cell to place the label in |
Definition at line 935 of file Plot.H.
|
inline |
|
protected |
|
protected |
|
GTK+ IOStream
Beta
|